Advitalize was born from a vision to enable low-AUM RIAs to accelerate growth and compete head-to-head in capabilities with “big-brand” firms while holding true to their essential presence in a local community.
Quality and timely research validates Advitalize’s vision and the opportunity at hand.
Click the Image to Download
Key Takeaways:
Mutual fund usage is in decline while individual bonds, ETFs, private equity, and direct indexing are on the rise.
Client acquisition and recruiting staff are the top priorities.
Top-performing firms are almost twice as likely to have a written strategic plan.
Firms spend slightly over 2% of revenue on marketing (i.e., $5,000 on revenue of $250k ($25M in AUM * 1% advisory fee)
Firms with marketing plans, client personas, and client value propositions grew clients 52% faster and AUM 46% faster.
Large firms use direct indexing more than double small firms.
Clients with <$1M in AUM are more than 50% of all firms but generate 22% of revenue.
Top-performing firms grew AUM at a 14.1% rate over 5 years vs. 5% for all other firms.
Click the Image to Download
Key Takeaways:
Firms with <$1B in AUM gain just 28% of clients from marketing activities vs. 43% firms with >$1 B.
70% of firms have the top strategic initiative “improving marketing and business development efforts”.
Clients with <$1M are 59% of clients but 26% of AUM in firms <$1B whereas small-AUM clients are 43% and 14% of AUM in firms >$1B.
Smaller firms discount fees at a higher rate than larger firms.
Smaller firms, when outsourcing investment services to model portfolios, use this for nearly all clients.
Advisors outsourcing investing save 9.1 hours/week.
Click the Image to Download
Key Takeaways:
The median AUM for a completed deal was $400M between January 2020 and March 2023.
The main driver of a seller’s interest was to “reduce operating duties and focus on client needs” followed by “full or partial liquidity”.
For buyers, the top reason was to acquire talent.
Median EBITDA multiple on completed deals was 9X.
68% of the deal price was in cash and the remainder in equity, with the average deferred payout at 2.5 years.
60% of acquirers expect deal volume to increase over the coming 5 years.
Click the Image to Download
Key Takeaways:
Firms >$100M in AUM are substantially more likely to have increased demand than advisors with <$50M.
Average marketing spend is $17.4K and 3.1% of budget.
53% of investors most want their advisors to provide educational content, but the dominating reasons for not doing so are is “not enough time” and “not sure how to go about it”.
47% of advisors do not have a regular outreach to promote expertise.
Click the Image to Download
Key Takeaways:
Orion was ranked as the top backoffice technology.
Total fees for a UMA through a TAMP are 1.5% – 2.5%, with larger accounts being charged between 100 and 175 bps.
UMA models cost between 35 and 50 bps.
RIAs are the top users of TAMPs at $93B followed by independent broker/dealers at $24.41B; the total market is $2 trillion.
TAMPs target client accounts with <$1M using mutual fund and ETF wrap accounts whereas larger-AUM clients emphasize UMAs.
The top reason for using a TAMP is “have more time to service clients’ needs”.
Click the Image to Download
Key Takeaways:
“Direct indexing allows investors to own the securities that make up an index and hold them in a separately managed account (SMA). This gives the investor the same market exposure as the index but also gives them the opportunity to build a customized portfolio. The investor can exclude certain securities or increase their exposure to other securities to reflect their specific goals, needs, or circumstances.”
The top benefits for direct indexing are: tax efficiency; customization; risk management; purpose-based investing.
Even in strong upmarkets, there are large percentages of an index that incur losses that will benefit from tax-loss harvesting.
HNW investors have been the traditional focus for direct indexing and its benefits.
Click the Image to Download
Key Takeaways:
84% of clients have <$1M in assets.
The main source of new business is referrals.
In-person client events are most effective in driving qualified leads followed by social media marketing.
Slightly more than half of advisors did not have a full-time role for marketing and business development.
Advisors believe that marketing efforts were average and marketing spend was under downward pressure.
M&A acquirers sought growth through a larger client base and increases in revenues.
Click the Image to Download
Key Takeaways:
In the US, about one third of Americans report working with a financial advisor, yet 62% report needing to improve their financial planning,
The two most-cited reasons given for hiring an advisor were Discomfort handling financial issues (32% of responses) and Specific financial needs (32% of responses). Participants also commonly cited Behavioral coaching (17%), Recommended by friends/family (12%), and Quality of relationship with advisor (10%).
Clients hired their advisor not just because they were looking for assistance with a specific financial problem. Indeed, they more often listed an emotional reason (60% of responses) than a financial reason (40% of the time) for hiring a financial advisor.
Click the Image to Download
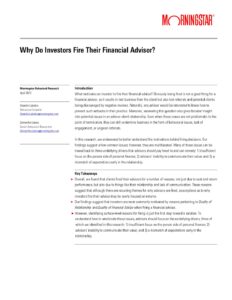
Key Takeaways:
Only 6% of our sample ever felt the need to break a relationship with an advisor, which generally means that firing is a relatively rare occurrence and is good news for advisors.
However, existing research notes that many people stick with their advisor because they don’t want to incur the cost of switching; instead, they choose to move assets out of an advisors’ practice instead of ending the relationship entirely.
The two most cited reasons investors fired their advisor were the Quality of Financial Advice and Services (32% of responses) and the Quality of The Relationship (21% of responses) categories. Responders also tended to cite Cost of Services (17%), Return Performance (11%), as well as their Comfort Handling Financial Issues on Their Own (10%) as reasons for firing.